May 4, 2021
Source: https://www.virginiastoner.com/writing/2021/5/4/the-deadly-covid-19-vaccine-coverup
Vaccine dangers hiding in plain sight
FACT: There has been a massive increase in deaths reported to the Vaccine Adverse Event Reporting System (VAERS) this year. That’s not a ‘conspiracy theory’, that’s an indisputable fact. You can try to explain it or justify it, or even argue it doesn’t matter, but you can’t deny it.
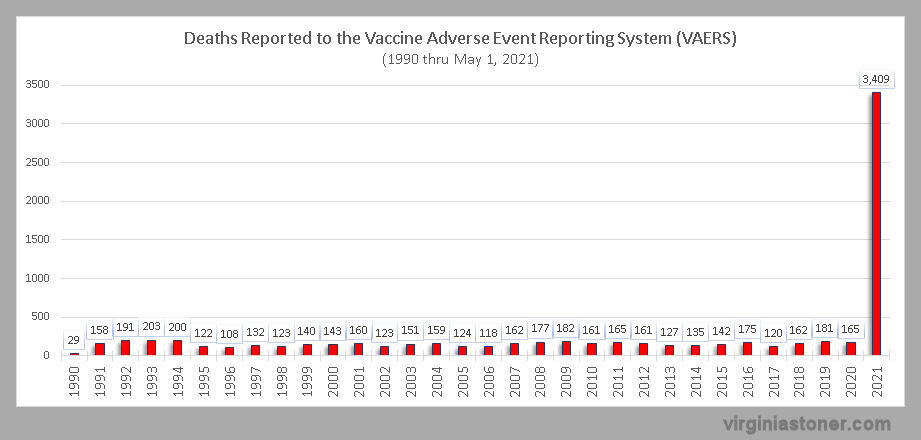
We’re not talking about a modest increase in death reports, something we might chat about in concerned voices over Chai tea and bagels at a company mixer. We’re talking about a huge and unprecedented increase—so massive that in the last 4 months alone, VAERS has received over 40% of all death reports it has ever received in its entire 30+year history. So massive it’s literally “off the chart.” The first chart in the pair below shows VAERS death reports from 2014 thru 2020. If you tried to add the 2021 data to it, it would be way, way off the chart. The second chart shows how much detail was lost when the 2021 data was squeezed in.
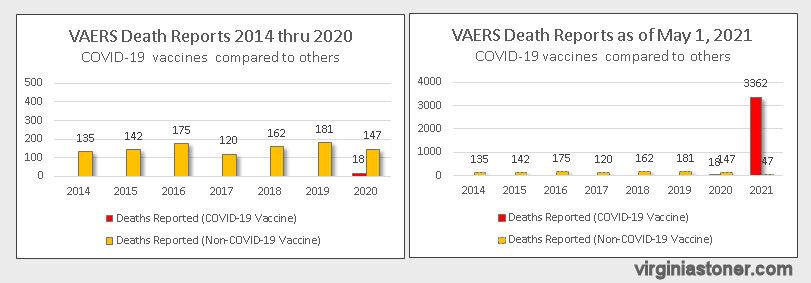
The pair of charts below are another illustration. Notice all age groups had an increase in death reports from the COVID-19 vaccines—with both the 18-64 and 65+ age groups experiencing a dramatic “off the chart” increase.

The increase in VAERS death reports is not due to more vaccination
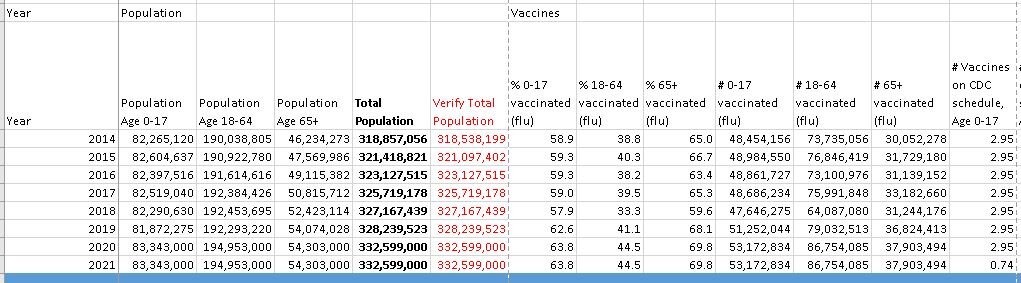
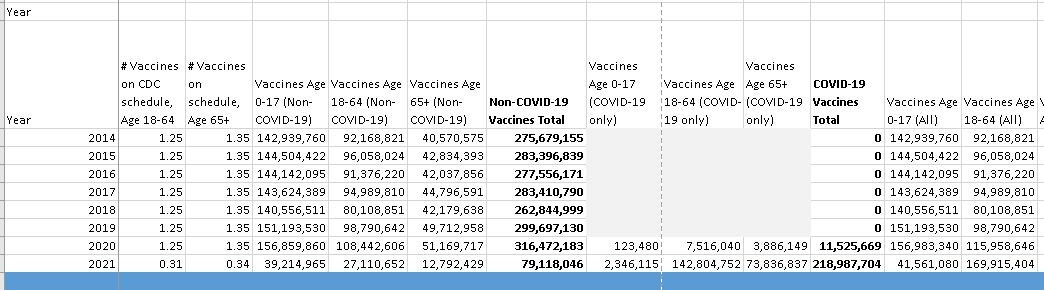
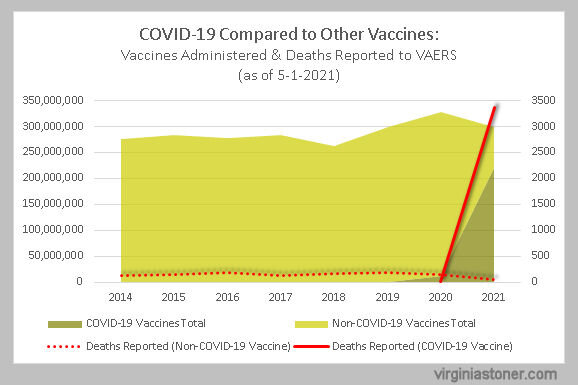
Even with the COVID-19 shots, the estimated total vaccines administered so far this year is less than the yearly average–because we are only a quarter of the way through this year. No doubt the vaccine count will climb much higher by the end of this year, but it’s not the reason for the massive increase in VAERS death reports over the last 4 months.
The following chart compares estimates of vaccines administered with deaths reported to VAERS, separating COVID-19 vaccines from other vaccines. The rate of reported deaths for other vaccines looks fairly normal; the massive increase is mainly from the COVID-19 vaccines.
There are many notes at the end of this paper about how the vaccine data was estimated, and where the data for these charts was obtained, along with the data table.
What the official experts have to say (*crickets*)
With all the many experts at the Centers for Disease Control (CDC) and the Food and Drug Administration (FDA) ostensibly dedicated to COVID-19 and vaccine safety, not a single one has attempted to explain or analyze, or has even mentioned, the massive increase in deaths reported to VAERS from the COVID-19 shots. The silence is telling.
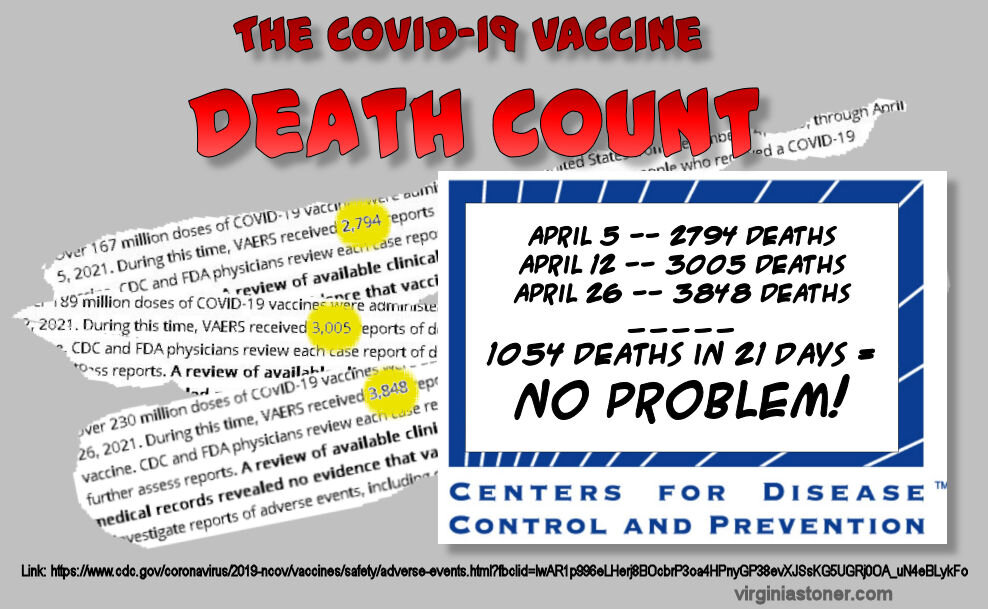
But it’s not as if VAERS death reports are being hidden, exactly. VAERS data is freely available to the public…and if you don’t want to look it up, you can follow the CDC’s COVID-19 Vaccine Death Count online, which is updated regularly. Just scroll down to the section called “Reports of death after COVID-19 vaccination” for the latest numbers. Most recently, the death count went from 2794 on April 5, to 3005 on April 12, to 3848 on April 26. But a mere 1054 deaths in 21 days is no problem for the CDC—it probably just means the vaccines are working.
I found only one paper (1) that mentioned VAERS death reports re COVID-19 vaccines. The lead author was Julianne Gee, from the CDC’s COVID-19 Response Team, and the paper concerned safety monitoring during the first month (December 14 to January 13). We are told, in the Summary:
“Monitoring … indicates reassuring safety profiles for COVID-19 vaccines. … No unusual or unexpected reporting patterns were detected.”
The authors said 113 deaths were reported to VAERS that month from the COVID-19 vaccines. Incredibly, they never compared that number to historical VAERS averages or trends…just kidding. Of course they compared it, realized it was shockingly higher than the historical average of 12 deaths per month, and decided not to mention it. Never let science interfere with good vaccine marketing.
Bizarrely, the authors actually implied the number of VAERS death reports indicated a safe vaccine, because a lot fewer deaths were reported to VAERS than they would have expected to see coincidentally among people who got the vaccine. Do you think that makes sense? I hope you said “no,” because it does not make sense. You can’t conclude a vaccine is safe because fewer people filed VAERS death reports than were expected to die coincidentally. I can’t even explain it in a way that makes sense—because it’s NONSENSE.
They were going to die anyway…someday
One hypothesis I’ve heard, and which is hinted at by Gee, et.al. in the paper above, is that the elderly and infirm, many in long-term care facilities, were the first to be targeted by the COVID-19 vaccine campaign, and they are much more likely to die coincidentally. These coincidental deaths then lead to an increase in suspected vaccine-induced deaths reported to VAERS. (*cough*)
VAERS data just does not support that hypothesis. First, because all age groups—not just seniors—had a dramatic increase in VAERS death reports from COVID-19 vaccines, as illustrated in the charts below. The red line represents reported COVID-19 vaccine deaths, and the green line represents other vaccines. Across the board, all age groups experienced a dramatic increase in deaths reported to VAERS from the COVID-19 shots—even the under 18 group, which has had very few COVID-19 shots (so far).

Second, the increase in death reports in the 65+ age group is just so massive that coincidental death, no matter how sickly the population, just doesn’t seem like a sufficient and plausible explanation. After all, the elderly and infirm in long-term care facilities are frequent targets of flu shot campaigns.
What does VAERS, and the people who tend to it, do all day?
VAERS is a “hypothesis generating system” that “identifies potential vaccine safety concerns that can be studied in more robust data systems.” VAERS uses data mining to “…identify disproportional adverse event reporting for vaccines, including COVID-19 vaccine.” VAERS also “identifies… adverse event-vaccine pairs reported at least twice as frequently as expected for a COVID-19 vaccine…” (2) (Pages 12-15)
Given the massive increase in deaths reported to VAERS—not a modest increase, but an enormous, unprecedented increase—it’s unfathomable that VAERS would not detect “disproportional” reporting, thus putting the wheels in motion to study the situation “in more robust data systems.” But there is no indication anything like that has occurred.
According to the CDC:
“VAERS has not detected patterns in cause of death that would indicate a safety problem with COVID-19 vaccines.”
Even as the death reports continue to roll in at an astonishing rate, by the dozens and sometimes hundreds per week, in true Orwellian fashion, the CDC simply updates the Death Count on its website and reiterates:
“VAERS has not detected patterns in cause of death that would indicate a safety problem with COVID-19 vaccines.”
And, of course, the old standby reassurance:
“COVID-19 vaccines are safe and effective.”

The only way it seems possible that VAERS did not detect any safety concerns, is if VAERS was actually programmed to expect a very high rate of deaths from the COVID-19 vaccines—much higher than the rate of deaths expected for other vaccines. That would explain why VAERS did not detect any “adverse event-vaccine pairs reported at least twice as frequently as expected for a COVID-19 vaccine…”
On the other hand, maybe people are just lying, and VAERS is either doing nothing at all, or something other than what we’re being told; or, it is detecting possible safety concerns with the COVID-19 vaccines like crazy, and it’s being covered up.
But, hey—never let it be said I don’t have an open mind. Maybe one of the many highly paid and respected experts at the CDC will do an analysis—like my humble analysis here, but bigger and fancier with more bells and whistles, because they are experts—and prove the massive increase in VAERS death reports has nothing to do with dangerous COVID-19 vaccines. But I won’t be holding my breath. I think if that could be done, it would have been done already—in triplicate.
***
NOTES:
1. Gee J, Marquez P, Su J, et al. First Month of COVID-19 Vaccine Safety Monitoring — United States, December 14, 2020–January 13, 2021. MMWR Morb Mortal Wkly Rep 2021;70:283–288. DOI: http://dx.doi.org/10.15585/mmwr.mm7008e3
2. COVID-19 vaccine safety update, Advisory Committee on Immunization Practices (ACIP) January 27, 2021, Tom Shimabukuro, MD, MPH, MBACDC COVID-19 Vaccine Task Force Vaccine Safety Team
3. Search VAERS data: https://vaers.hhs.gov/data.html
4. There were a lot of “unknown age” VAERS death reports—sometimes dozens or even hundreds per year. Therefore, 1/3 of the unknown age reports were added to each of the 3 age groups of 0-17, 18-64 and 65+.
5. US Census Bureau data was used for the years 2014-2020. For 2021, the 2020 population estimates were used.
6. 2014: https://data.census.gov/cedsci/table?q=census%20age%202014-2020&tid=ACSST1Y2014.S0101
7. 2015: https://data.census.gov/cedsci/table?q=population%20by%20age%202015&tid=ACSST1Y2015.S0101
8. 2016: https://data.census.gov/cedsci/table?q=age%20%26%20sex%202016&tid=ACSST1Y2016.S0101
9. 2017: https://data.census.gov/cedsci/table?q=age%20%26%20sex%202017&tid=ACSST1Y2017.S0101
10. 2018: https://data.census.gov/cedsci/table?q=age%20%26%20sex%202018&tid=ACSST1Y2018.S0101
11. 2019: https://data.census.gov/cedsci/table?q=age%20%26%20sex%202020&tid=ACSST1Y2019.S0101
12. 2020: https://www.census.gov/data/tables/2020/demo/popest/2020-demographic-analysis-tables.html
13. Age data was consolidated into 3 uniform groups of Age 0-17, Age 18-64 & Age 65+. The Census Bureau uses a 0-19 age range, and no adjustments were made for that.
14. The CDC’s estimated rate of flu vaccination for 2010-2020 was used to estimate the rate of all vaccinations. https://www.cdc.gov/flu/fluvaxview/coverage-1920estimates.htm
15. % vaccinated in each age group for flu was used to estimate the rate of vaccination per the CDC’s vaccine schedule for non-COVID-19 vaccines.
16. Minimum recommended vaccines for each age group were divided among the years in the age group to estimate yearly vaccine consumption:
17. Age 0-17: 18 flu shots + 35 other shots = 53 / 18 = 2.94 per year.
18. Age 18-64: 45 yrs, 45 flu shots + 12 more recommended for everyone (18 more for some) = 45 + 12 = 57 / 45 = 1.24 per year.
19. Age 65+: 15 yrs: 15 flu shots + 5 more recommended for all (18 more recommended for some) = 15 + 5 = 20 / 15= 1.33 per year.
20. CDC’s child and adolescent vaccine schedule: https://www.cdc.gov/vaccines/schedules/hcp/imz/child-adolescent.html
21. CDC’s adult vaccine schedule: https://www.cdc.gov/vaccines/schedules/hcp/imz/adult.html
22. For COVID-19 vaccines I used the total # administered in each age group and estimated 5% were given in 2020 and 95% were given in 2021. https://covid.cdc.gov/covid-data-tracker/#vaccination-demographic